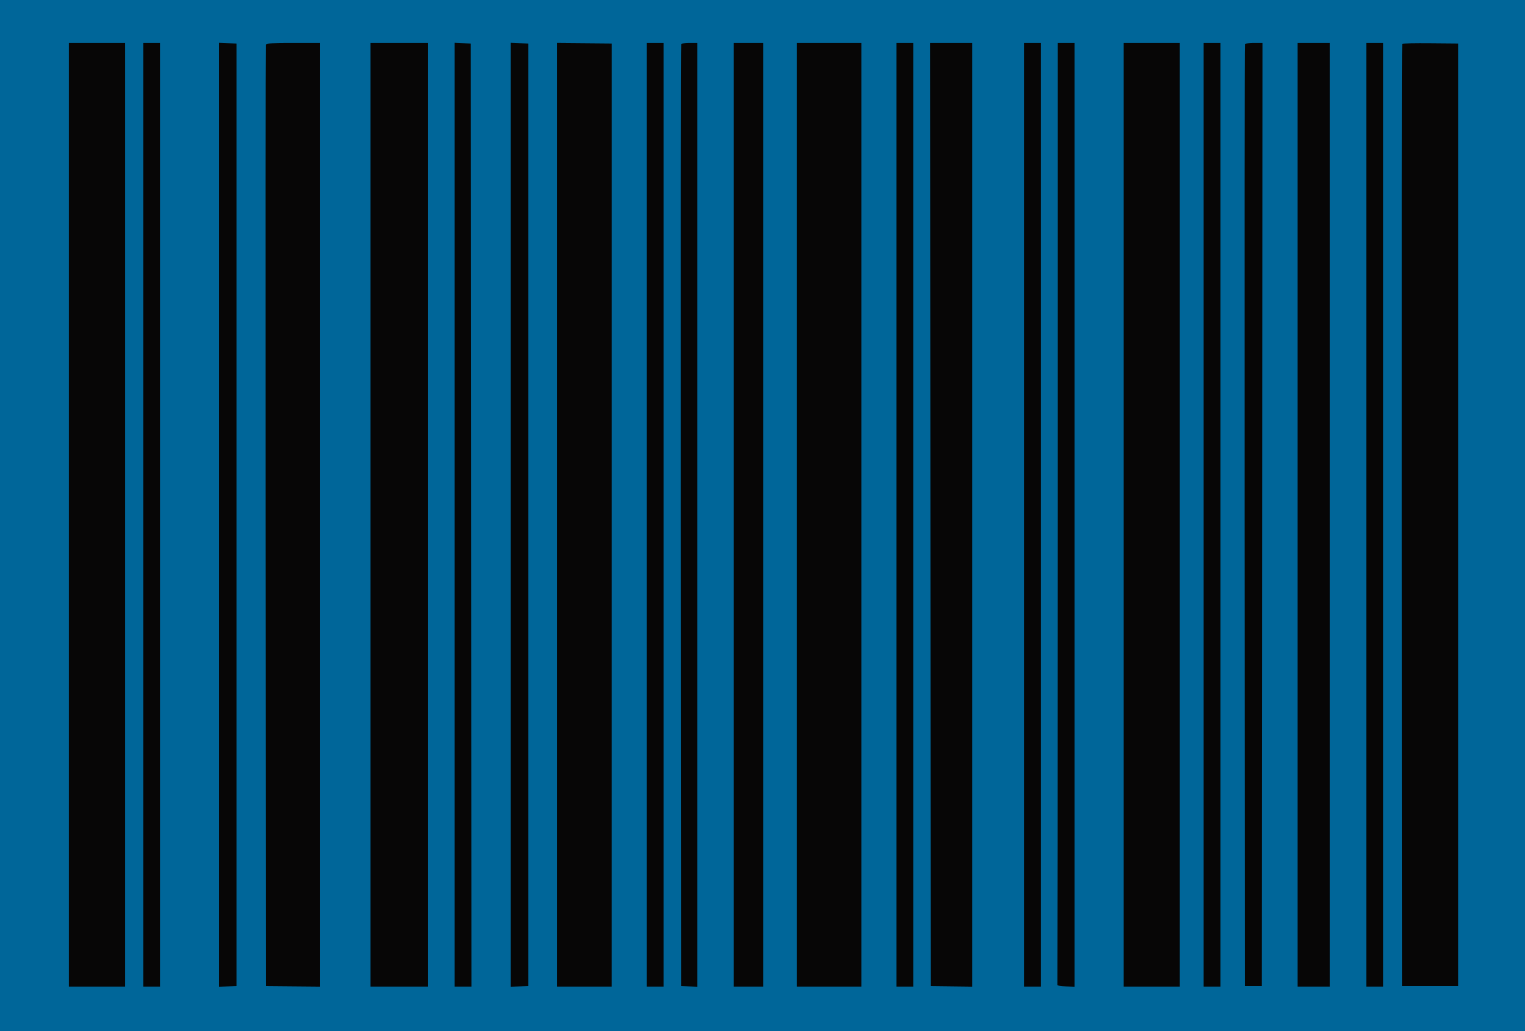
The barcode is one of those modern innovations that are now common to the point of mundanity but would astonish a time traveler from a different century. The idea of automating supermarket checkout, which inspired the barcode, had been around since the 1930s. But a design for the barcode, a machine-readable label that encoded a product identifier and made automated checkout possible, didn’t emerge until the late 1940s. Even after that, it took roughly a quarter century before the first commercial UPC barcode was scanned at the Marsh Supermarket in Troy, Ohio, on June 26, 1974.
Today, barcodes can be found on countless products sold in supermarkets and other stores. The barcode, originally devised for automating checkout, has spread far beyond the retail industry, becoming a versatile tool for identifying and tracking physical objects in manufacturing, logistics, healthcare, transportation, and more. It is estimated (opens in a new tab) that more than one billion products have a unique barcode for identification and over 10 billion barcodes are scanned daily across the world.
Here is the story of how the barcode was invented and spread into every corner of commerce and industry.
The supermarket checkout problem
Before the barcode was invented, the cashier manning the register at a grocery store or supermarket had to key (manually enter) prices to process transactions. The process was predictably onerous: employees had to place price labels on items, or stamp prices directly on item packaging, while cashiers read the prices off items at checkout and entered them by hand into a cash register.1 The process was also error-prone: cashiers could, and often did, enter wrong prices without customers noticing because receipts were generally unitemized.2 Inaccurate price entry also affected retailers who lost money when cashiers underbilled customers; automatic price entry could solve the problem but was impractical as price labels weren’t machine-readable.3
These problems had the same root cause: checkout systems couldn't automatically read product information, or identify products bought by customers. This limitation made it impossible to automate supermarket checkout, which increased labor costs for retailers. It also reduced customer satisfaction: asides from finding issues with cashier errors, many customers disliked the long wait times.
In 1932, a Harvard business student, Wallace Flint, conceived a system that could potentially make automated checkout a reality. The system used a combination of punch cards and automated storeroom flow racks to help customers bypass the manual checkout line. However, it was too complicated and impractical, plus few were willing to fund experimental research at the time due to Great Depression’s impact on economic growth.4
Years would pass until someone decided to revisit the problem of automating checkout in grocery stores and supermarkets. In 1948, Samuel Friedland, founder and president of Food Fair (a supermarket chain headquartered in Philadelphia) visited the Drexel Institute of Technology (opens in a new tab) to seek the help of Drexel’s engineering department in devising an automated checkout solution for his supermarkets. He wanted a way to encode product information, such as item prices, in machine-readable format, so that cashiers wouldn't have to manually enter prices at checkout.
Supermarket executives like Friedland had to confront problems that accompanied the lack of automated checkout, including long wait times, high labor costs, and frequent entry errors. Moreover, the absence of a machine-readable label checkout systems could use to identify products being sold meant retailers like Food Fair had zero visibility into inventory and buying patterns. Retailers couldn’t understand what customers were buying, or what products sold well and did not, nor could they track inventory in real-time as customers checked out.5
The dean who met with Friedland declined the supermarket executive’s request to help solve the automated checkout problem, as he felt it to be outside the school’s curriculum. However, Bernard Silver, an engineering student at Drexel, had overheard the conversation and became interested in solving the problem. Later, Silver approached Joseph Woodland, another engineering student at Drexel and asked if he wanted to work together on a solution. Woodland agreed and the two started working on a series of experiments in late 1948.

The first prototype Woodland and Silver developed (opens in a new tab) used patterns of ink that glowed under ultraviolet (UV) light. They built a device to test the concept, but the design faced several problems, ranging from the difficulty of printing the patterns and the cost of specialized light-sensitive ink the design needed to work.
Despite the duo’s early failures, Woodland was convinced he could find a working solution. He famously dropped out of Drexel’s graduate school, where he had been studying for a Master's in Engineering, and moved to his grandparents’ home in Miami Beach in the winter of 1948 to dedicate all his time to the project. A few months later, Woodland was idling at the beach and drawing lines in the sand when he had a breakthrough that would lead to the first barcode design. Woodland had learned Morse code as a Boy Scout and, as he recounted later (opens in a new tab), was inspired by the idea of encoding information in symbols and using signals to communicate and interpret messages.
The Morse code connection
Morse code (opens in a new tab) is a system of communication that uses the timing and spacing of signals to communicate information. In this system, text characters (letters and numbers) are encoded as combinations of signals with varying durations, otherwise called short signals and long signals. Signals are pulses of energy that take various forms, such as radio waves, electrical pulses, sound waves, and light waves: Morse code relies on the timing of these pulses; specifically how long each signal lasts, and the gaps between consecutive signals, to encode and decode messages.6
Visually, short signals are represented as dots and long signals as dashes: the popular “SOS” signal is written in Morse code as a combination of three short signals (dots), three long signals (dashes), and three short signals (dots) or · · · — — — · · ·. If the receiver of a message written in Morse code understands the signal timing and spacing rules used by the sender, they can decode it and recover the original information.
Woodland was drawing Morse symbols in the sand at the beach when he realized that the short and long signals could also be visually represented as narrow and wide bars. Specifically, he drew dots and dashes in the sand, and then parallel lines from the edge of each mark down to the same baseline, turning the dots into narrow bars and dashes into wide bars with blank spaces interspersed throughout. The pattern Woodland created by drawing parallel lines in the sand became the basis of the linear barcode.
Since the bars were derived from the standard marks used in Morse code, they could similarly encode information when printed on paper. While Morse code used the duration and spacing of signals to encode information, Woodland’s code would use the widths and arrangement of printed bars and blank spaces to encode information. Woodland wasn’t trying to create a Morse code alternative, though; he only wanted a way for checkout systems to capture product information without a human having to enter said information.
The Morse-code-inspired system provided just that. As Woodland envisioned it, the barcode’s pattern of narrow and wide bars could encode information identifying a product, such as a unique product identifier. The barcode label would be printed on product packaging and read at checkout by a barcode scanner that decoded the pattern and retrieved the identifier. A computer system, connected to an electronic information index holding product records, received the product identifier and used it to locate the scanned item’s price and description. The computer would automatically send this data to the cash register, activating mechanical price indicators for both the cashier and the customer to see.
The connection between Morse code and the barcode might be hard to see unless we explore details of how the proposed barcode scanner worked. The scanner was actually an optical reader, a device that could convert visual images and symbols into binary data. Optical readers worked by projecting light onto a surface and detecting differences in the reflected light, which they transformed into binary information that a computer could process. In Morse code, information was decoded by measuring the duration of and the intervals between signals; the optical reader used the same idea to recover information encoded in a barcode according to the arrangement of bars and spaces.
When a barcode was scanned, the optical reader projected light on the pattern, which consisted of narrow and wide bars and spaces printed in contrasting black and white colors. As the light moved across the barcode pattern, narrow and wide black bars produced short and long intervals of low-reflected light, respectively. At the same time, the narrow and wide white spaces produced short and long intervals of high-reflected light, respectively.7 A photodiode sensor converted the fluctuating light waves directly into electrical signals, and an internal decoder circuit converted those electrical signals into binary data (0s and 1s) that a computing system could understand. The binary data was what the computer used to locate information for the scanned item in the supermarket database.

An invention ahead of its time
Woodland and Silver filed to patent the barcode in 1949, eventually receiving the patent in 1952 (opens in a new tab). However, the invention was ahead of its time and difficult to implement; particularly, optical reading technology, which was important for barcodes to work, was primitive. Woodland and Silver devised a crude prototype of the barcode system that used a powerful 500-watt incandescent light bulb to illuminate the pattern, a photosensitive component to convert changes in reflected light into electrical signals, and an oscilloscope (opens in a new tab) to display the electrical signals generated as different-colored regions in the barcode pattern reflected varying amounts of light.
The proposed barcode design had changed by this point, with a combination of concentric circles, or a “bullseye”, replacing the linear bars. The bullseye pattern was adopted because it was omnidirectional, meaning a scanner could read it from any angle, whereas the original design required scanning the pattern in a specific direction. The bullseye pattern still encoded information in the differences between widths and spacing of dark and light regions, just like the linear pattern Woodland developed initially. However, it arranged the regions as concentric rings instead of parallel bars.
Woodland and Silver’s prototype was large and clunky, with historical accounts of the barcode’s invention (opens in a new tab) suggesting it was as big as an office desk. More importantly, the prototype lacked a compact computer that could decode electrical signals produced by scanning the barcode into product information.8 In other words, Woodland and Silver could show that a printed barcode produced readable electrical signals when scanned, but the product identifier encoded in the pattern could not be extracted and used to pull an item’s information at checkout. This limitation made the barcode system of little use to supermarkets trying to solve the checkout problem.
The duo wound up selling the patent for just $15,000 to Philco, a major American manufacturer of consumer electronics. The patent changed hands again when Philco sold it to Radio Corporation of America (RCA), another major American manufacturer of industrial and consumer electronics. Meanwhile, Woodland had already joined International Business Machines (IBM) in 1951, hoping to leverage IBM’s research and development (R&D) resources to produce a commercially viable version of the barcode he had developed many years ago and patented with his colleague.9
The Universal Product Code
The rise of consumer culture in America, which greatly accelerated throughout the 1950s and 1960s, led to a massive increase in consumer shopping and booming fortunes for the retail industry. By the late 1960s, retailers were making more than $100 billion in sales annually (opens in a new tab), benefiting from a strong postwar economy, expansion of consumer credit, and rise of suburban housing. The executives running these supermarket chains should have been pleased with the growth, and they were, but the upwards trend in consumer shopping exacerbated the problems Woodland and Silver tried to solve many years ago with the barcode.
Nearly two decades had passed since the supermarket executive approached Drexel Institute about working on a solution for automatically capturing product information at checkout, but little had changed about checkout systems. Supermarkets still relied on employees to attach price tags to items, enter product information at checkout, and do most of the inventory-tracking work manually. Also, retailers still had little to no visibility into customers were buying and couldn’t easily use purchase patterns to optimize inventory and sales. The manual process also increased labor costs and reduced customer satisfaction, as checkout lanes moved slowly and cashiers occasionally made errors when entering prices.
Starting in 1969, a consortium of American retailers, manufacturers, and suppliers of grocery items decided to tackle the problem. They agreed on the need for a standardized machine-readable product identifier that could be printed on packaged goods sold in stores and automatically scanned at checkout. The identifier, known as Universal Product Code (UPC), would uniquely identify a product: checkout systems used the scanned product code to retrieve the product’s price, description, manufacturer, and other product information from the retailer’s database.10
The barcode was the natural format for the proposed Universal Product Code (opens in a new tab); after all, it had been conceived specifically to make product information easy for machines to read. Moreover, advances in computing and laser hardware had suddenly made it practical to scan barcodes reliably and efficiently.11 These technological breakthroughs, coupled with demand from major retailers and manufacturers, paved way for the development of the commercial barcode.
An ad hoc committee was formed in 1970 by retailers and manufacturers of packaged goods to work on standardizing the Universal Product Code. The committee initially specified a product code consisting of 10 decimal digits that identified the product and the manufacturer. A Symbol Selection Committee, made up of technical experts, was subsequently formed to choose a design for the barcode that would carry the UPC number. The committee established several requirements (opens in a new tab) for the UPC barcode format:
- It must be small and neat.
- It must cheap to print.
- It must be readable from any direction.
- It must be highly accurate.
Concretely, the winning barcode design could occupy no more than 1.5 square inches and had to be printable using existing technology for standard product labels. It also had to be quickly readable from any direction and produce fewer than one error in 20,000 scans.
The selection committee invited companies to submit proposals and received seven submissions. The companies that submitted barcode systems for evaluation included Radio Corporation of America (RCA), which now held Woodland’s barcode patent, and International Business Machines (IBM), where Woodland had been working since 1951.
Ownership of the original patent, combined with a renowned, highly productive R&D program12, put RCA in a good position just as retail industry leaders taking barcode technology seriously. The company turned Woodland’s original bullseye design into a functional barcode and performed an extended real-world trial (opens in a new tab) at a Kroger supermarket in Cincinnati beginning in July 1972.13 However, in a twist of irony, RCA lost to IBM in the selection process, even though it had already demonstrated a working supermarket barcode system and done more real-world testing.

Woodland worked in IBM’s Store System Group (opens in a new tab), a division that produced point-of-sale (POS) systems and related technology for retailers. The Store System Group was behind the barcode proposal that IBM submitted to the Symbol Committee. Although Woodland contributed to the proposal, George Laurer, who led the barcode development project, rejected the original bullseye pattern in favor of the now-familiar rectangular pattern of vertical black bars and white spaces.
According to multiple accounts, including IBM’s history of the UPC barcode (opens in a new tab), Laurer switched to the rectangular barcode because it was easier to print and less vulnerable to printing imperfections. The bullseye barcode was more omnidirectional (i.e., it was easier to scan from any angle), but it was prone to smearing when printed. Ink smears, which distorted the widths and spacing of concentric rings, made it difficult for scanners to reliably read the bullseye barcode. Laurer explained to IBM executives that the rectangular barcode didn’t have the same issues with smearing and was better than RCA’s bullseye barcode.
Woodland, alongside other IBM executives, approved the new design and gave Laurer permission to develop a prototype. The prototype barcode presented by Laurer’s team consisted of 30 black bars and 29 white spaces of varying widths arranged in a rectangular pattern. The widths and spacing of those bars and spaces represented an item’s Universal Product Code in a 95-bit binary pattern. After scanning the barcode, the checkout system decoded the pattern into the UPC number and used it to query the supermarket’s database for information about the item.
The barcode designed by Laurer’s team at IBM met all of the design requirements established by the Symbol Selection Committee. It was small and neat, could be printed without smearing, and supported omnidirectional scanning with a laser. To prove the code’s speed and accuracy, the team printed barcodes on beanbag ash trays (opens in a new tab) and asked a skilled softball pitcher on the team to throw the items over a prototype scanner at high speed. The scanner correctly read all barcodes, which convinced remaining skeptics within IBM, including Laurer’s manager, B.O. Evans, that the design could work.

On March 30, 1973, members of the Symbol Selection Committee met in New York to make their final decision. Laurer’s rectangular barcode was selected ahead of designs submitted by RCA and other companies participating in the selection process. The Universal Product Code was formally unveiled two days later on April 1, 1973. In 1974, the Uniform Code Council was appointed as administrator of the UPC standard, and began assigning identification numbers to manufacturers shortly after.
Scanning first supermarket barcode
On June 26, 1974, a Marsh Supermarket in Troy, Ohio became the site of the first commercial barcode scan. Clyde Dawson, Marsh’s head of R&D, presented a pack of Wrigley’s Juicy Fruit gum14 to cashier Sharon Buchanan, who scanned the barcode and completed the checkout without manually entering the item’s price into the register. The barcode-powered checkout system used in the store used equipment jointly developed by National Cash Register and Spectra-Physics.
Spectra-Physics, which had been manufacturing laser equipment since 1962, supplied the barcode scanner (opens in a new tab) installed at the checkout counter. Inside the scanner, a helium-neon laser projected light onto a rotating mirror, which redirected the beam upward through a glass window and swept it across the barcode held above the scanner. Light reflected by the barcode pattern traveled back through the glass and into the scanner, where a light sensor (photodiode) detected changes in reflected light and converted those fluctuations into electrical signals. The scanner’s electronic components transformed those signals into a binary pattern representing the item’s product identifier; the UPC number was decoded from this pattern and passed to the computerized checkout system.
National Cash Register manufactured the computerized checkout system (opens in a new tab), the NCR 255, that worked with the Spectra-Physics barcode scanner. The NCR 255 was a point-of-sale (POS) terminal installed at each checkout lane for processing customer transactions and displaying information such as item descriptions and prices. Though it was computerized, the NCR 255 terminal did not perform the actual price and product lookups. Instead, it communicated with the NCR 726 minicomputer, which received the UPC number for an item and used it to look up the item’s information in the database.
The NCR 726 was smaller than early computers (e.g., ENIAC), but it was still too large to install at checkout. Cables connected the terminals to the minicomputer, which was usually installed in a back room or elsewhere in the store, and each terminal had a separate address (opens in a new tab) on the local communications network . The NCR 726 acted as a central processor for all the terminals and used network addresses to dispatch product information to the correct checkout lane.

A bumpy road to adoption
After the first commercial UPC barcode scan in 1974, many, including executives in the retail industry, expected adoption of the new technology to progress smoothly. But that never happened for different reasons. In fact, the barcode came very close to becoming another technology that failed to live up to expectations. Adoption of the barcode was slow for two reasons: high cost of adopting the technology and backlash from consumers opposed to new barcode-powered checkout systems.
Although barcode technology benefited both manufacturers and retailers, adoption incurred significant equipment, installation, and labor costs. Manufacturers estimated they would have to spend $200 million annually on printing barcode labels, not including the initial cost of modifying packaging equipment to support barcode printing. On their part, retailers would have to spend between $200,000 and $250,000 to buy, install, and operate the barcode scanners and computerized checkout systems to deploy the new technology in grocery stores and supermarkets.15
What ensued afterward was a classic chicken-and-egg problem. Manufacturers wouldn’t invest in barcode printing if retailers lacked technology to scan and process barcodes, and retailers wouldn’t invest in barcode scanning and computerized checkout if manufacturers refused to print barcodes on items. An estimated 75% of grocery items, or more, had to carry a barcode before investments in barcode technology broke even. We can explain the problem in more detail below.
For a retailer, the majority (i.e., at least 75%) of items coming down the conveyor belt had to carry a barcode that a cashier could quickly scan to pull item information and process transactions. The barcodes made it unnecessary for cashiers manually key in prices, meaning checkout lines could move fast enough to increase total sales volumes, slash cashier labor costs, and help supermarkets recoup money invested in computerized checkout infrastructure. For a manufacturer, enough retailers had to adopt barcode scanning to justify investing in barcode printing machines. Since retailers wouldn’t buy barcode scanners if most items lacked barcodes, and no single manufacturer supplied anything close to 75% of a supermarket’s inventory, a single manufacturer printing barcodes on items while the rest sold items without barcodes would simply waste capital. The entire retail industry was effectively trapped in a standoff, with broad adoption of the barcode depending on whether retailers and manufacturers could deploy the technology simultaneously.
The retail industry also had to deal with resistance to barcodes from an unexpected source: consumers. Much of the planning and deliberations surrounding the development of the UPC barcode had happened, arguably justifiably, without input from consumers. Executives likely expected consumers would welcome the decision to introduce barcodes, especially since it meant faster checkout lines and lower billing errors, and hardly anticipated consumers strongly protesting in favor of keeping price labels.
But that is exactly what happened. After the barcode’s introduction in 1973, and the first commercial UPC barcode scan in 1974, protests erupted as supermarkets replaced individual item pricing with shelf pricing. In individual item pricing, each item carried a distinct, specific price reflected in the price label; in shelf pricing, item prices were displayed on price tags attached to the store shelves, directly under where products sat, instead of on the products themselves.
Retailers justified phasing out individual item pricing on the account of barcode-powered, computerized checkout systems making it unnecessary to attach price labels. Cashiers could simply look up item prices by scanning the UPC barcode instead of reading the price of the tag. Also, supermarket executives wished to offset the cost of buying expensive barcode technology with savings on labor costs that would come once employees were no longer required to manually attach price labels to thousands of items.
However, consumer advocates claimed individual item pricing was an attempt to “rip off” consumers by making it difficult to compare prices on items while walking around the store. They also argued the new system would make it difficult to verify if customers were being charged correctly at checkout, as items would have no price information.16 One of the most famous consumer advocates opposed to the change was Carol Tucker-Foreman, who served as the president of the Consumer Federation of America (CFA) from 1973 to 1977. She provided formidable opposition to grocery store executives on the issue and appeared in countless interviews, TV shows, including The Phil Donahue Show, debates, and even Congressional hearings. Her efforts inspired nationwide opposition to the removal of individual item pricing, while other consumer advocacy groups and labor unions organized protests to prevent stores from installing barcode equipment.
Other arguments against adopting the UPC barcode, including claims it represented the Biblical “mark of the Beast” (opens in a new tab), were less credible.17 But the strength of public opposition to the technology, coupled with the steep costs of implementation, was enough to slow down retail adoption of barcodes. By the end of the 1970s, less than 1% of US retailers had installed barcode scanners, and many supermarket executives had “lost their enthusiasm for the system”, as a 1978 article in the Lansing State Journal described it.
The barcode goes mainstream
Things began to look different for adoption of barcodes in subsequent years. More manufacturers started printing barcodes on items, with companies like IBM providing engineering and consulting support so manufacturers could acquire the technology for working with the UPC system. IBM also contributed to efforts to reduce the cost of deploying barcode technology in stores, releasing new and cheaper barcode scanners as well as point-of-sale (POS) and supermarket checkout infrastructure that helped stores integrate barcode scanning directly into checkout operations and reduced overall procurement costs. It also helped that consumer opposition to the barcode and shelf pricing had ebbed after peaking in the 1970s, especially as major faces of the opposition turned their attention elsewhere.18
Adoption of the barcode among retailers particularly accelerated once major retail chains, like Kmart and Walmart, started rolling out barcode scanners and automated checkout lanes in stores. In time, retailers realized the value of the barcode went beyond faster checkout. Every time a barcode was scanned, the system logged what was sold, giving retailers real-time visibility into inventory and customer purchasing patterns. Retailers could identify products that sold well and those that didn’t, determine when items had to be restocked, make stocking and pricing decisions based on actual sales data rather than relying on estimates and item counts derived manually by store management and employees.
In the early 1980s, Symbol Technologies released the LS7000, one of the first commercially successful hanheld barcode scanners. The arrival of handheld, portable barcode scanners slashed scanning equipment costs and made it possible to scan barcodes anywhere. It also marked a shift in how retailers used barcode technology: instead of using barcodes exclusively in checkout systems, retailers deployed the technology in stockrooms, warehouses, distribution centers, and any other area that benefitted from automatic product identification and data capture. A retailer could use barcodes to track movement of items through distribution networks, update inventory records in real-time, and support shipping operations.

Manufacturers also discovered the benefits of adopting the barcode. Take, for example, an automobile manufacturer making car parts in-house: car parts often needed to complete several stages in the production process, including welding, rustproofing, painting, and inspection, before they could be assembled. Previously, workers might have to rely on paper labels, cards, and other manual records to track a part as it moved through different production stages. Adopting barcodes removed this requirement: a single barcode attached to the part could be scanned at various points in the production process, updating the central production system and automatically logging which processes the part had completed without anyone having to manually record the information.
Barcodes also helped manufacturers track inventory within factories. In a place like an auto factory, workers relied on manual systems that required recording how many parts a particular production process consumed on paper or cards. A dedidated worker might collect these records from the production lines and hand them to the factory manager, who would aggregate the records to determine how much inventory had been used and what was left. That requirement, too, disappeared once the manufacturer started printing barcode identifiers on parts. A factory worker could the barcode on a part immediately before production started to update the inventory: the scan told the database the part had been consumed by a new product process and should be removed from available inventory.
In the retail industry, the barcode improved productivity, slashed labor costs, and led to increased visibility into the sale and movement of products. They had a similar effect in the manufacturing industry, where barcode technology helped reduce manual labor, raise worker efficiency, and better monitor the flow of production parts, raw materials, and finished goods. Over time, manufacturers would find new, valuable ways to integrate barcode technology into their production and distribution processes.
Raising the bar for innovation
More than 10 billion barcode scans are completed every day, nearly equal to the number of Google search queries performed every day. Barcodes appear on almost every physical object, from library books and hospital wristbands, and the technology has proliferated across logistics, manufacturing, healthcare, transportation, and arguably every part of the modern economy.
What began as a solution for automating checkout became something more valuable: a technology for capturing information about objects in the physical world and connecting digital systems to that information to create new applications and devise new systems. As author Jordan Frith, who wrote a book about the barcode’s history called A Billion Little Pieces, put it: “Barcodes were a crucial forerunner to the hybridity of our contemporary world...They made physical objects digitally identifiable, bridging the gap between the materiality of objects and the digitality of back-end databases.”
The barcode’s impact goes beyond the value it has created in commerce and and industry over the years. In particular, the barcode’s success established automatic identification and data capture (AIDC) as a field of technology. Subsequent innovations in this field, such as the Quick Response (QR) code, built on the same idea as the barcode: connecting the physical and digital worlds by giving physical objects machine-readable identifiers that a computer could process and use to retrieve digital data associated with that item in a database. Other technologies, including Radio Frequency Identification (RFID), Optical Character Recognition (OCR), biometrics, mobile imaging, and facial recognition would emerge following the barcode’s introduction and broaden the idea of, and approaches to, automated identification and data capture. Each one had a different technological lineage, but their success had something to do in part to the success of the barcode in proving the viability and importance of the AIDC technology.
No one, not even the inventors, could have imagined the barcode becoming one of the most important technological innovations of the last century. The barcode’s story can teach many things about the nature of innovation, creativity, risk-taking, consumer psychology, product standards, competition, technological diffusion, and so much more. But perhaps the most important lesson it teaches is that humans are amazing at turning necessity into invention and good ideas can languish in obscurity until the right conditions arrive, at which point those ideas flourish and lead to real-world breakthroughs.